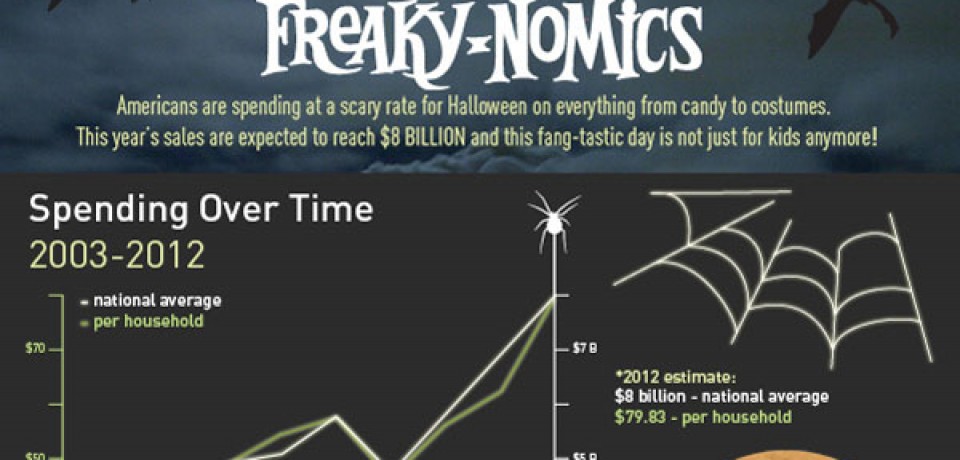
Americans are spending at a scary rate for Halloween on everything from candy to costumes. This yearâs sales are expected to reach $8 BILLLION and this fang-tastic day is not just for kids anymore!
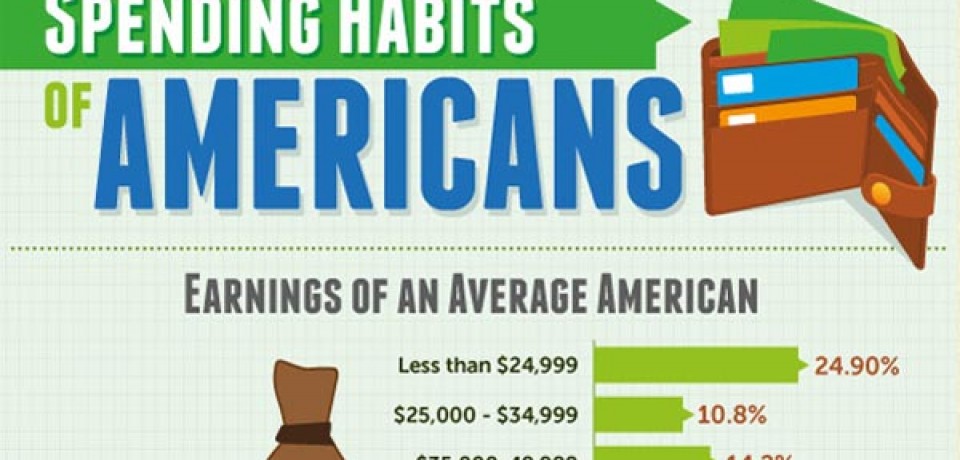
Americans spending habits vary greatly depending on income and gender. Did you also know that Americans spend more on housing but less on food now than in 1949? Check out the below infographic to see how Americans use their hard earned dollars.
Women business owners are #PoweringTomorrow. To illustrate the path of the 8.3 million women-owned businesses across the US, American Express OPEN is launching a series of infographics that visualize the key findings from the second State of Women-Owned Businesses Report.
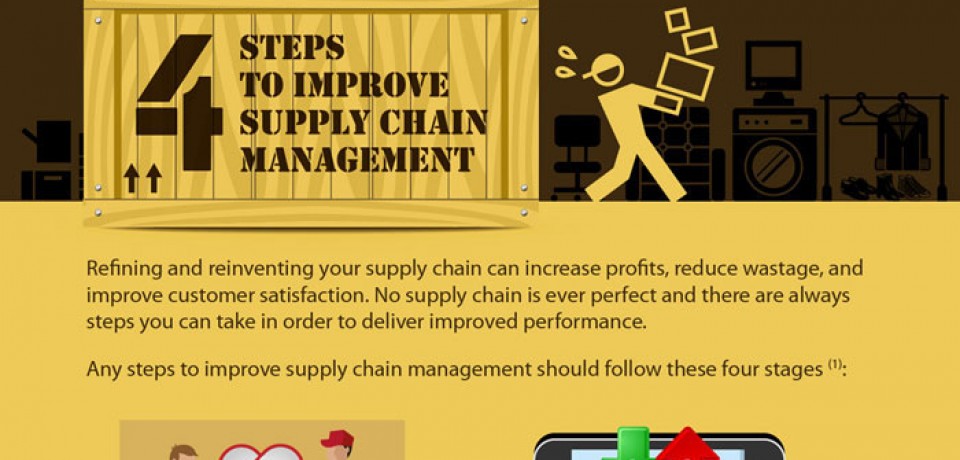
Refining and reinventing your supply chain can increase profits, reduce wastage, and improve customer satisfaction. No supply chain is ever perfect and there are always steps you can take in order to deliver improved performance.
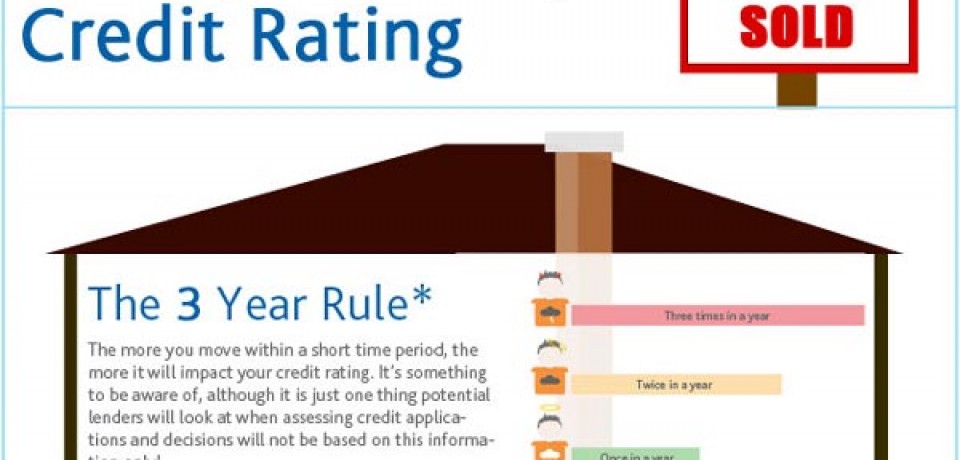
Specialist lender aqua card has released a graphic which will help home-movers understand the impact that moving house might have on their credit rating, and the steps they can take to minimise the damage.
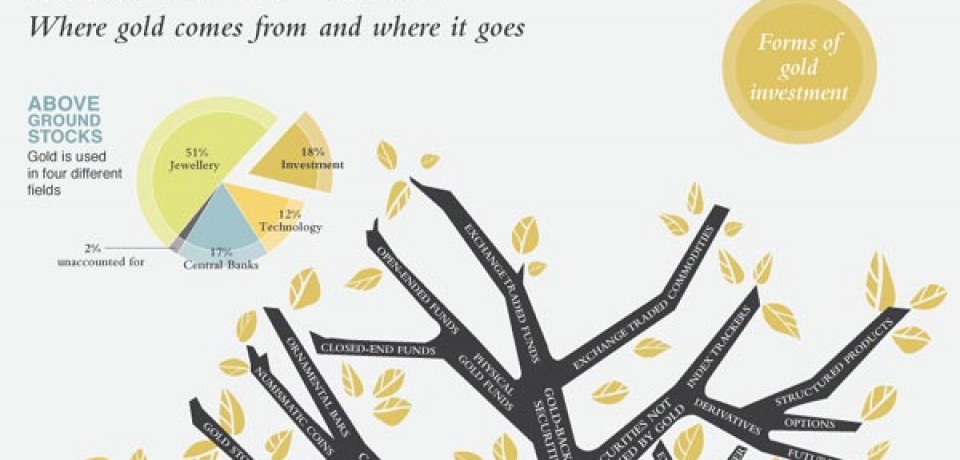
The Gold Tree Infographic visualizes above-ground stock of gold, sources of gold broken down to continents and countries and uses of gold. The infographic pictures the different forms of gold investments – ranging from physical gold in the form of bullion gold to securities not backed by gold.


![IBM – Inside the Brain of a CEO [Infographic]](https://www.onlyinfographic.com/wp-content/uploads/2012/05/ibm-960x460.jpg)