
Students rarely think about the future. However, there comes a time when any university graduate is faced with a choice. It is about the moment when the carefree years of being left behind and there is a need to seek work. Essay writing service EssayMama.com created a useful infographic, displaying the latest trends from the […]
![What Professions Are Popular Among Grades in 2014 [Infographic]](https://www.onlyinfographic.com/wp-content/uploads/2014/07/professions-2014-960x460.png)
![Education Spending: Where Are Our Priorities? [Infographic]](https://www.onlyinfographic.com/wp-content/uploads/2014/04/education-960x460.png)
![Disability in America [Infographic]](https://www.onlyinfographic.com/wp-content/uploads/2014/03/disability-america-960x460.png)
![Diversity in Higher Ed: Are We All Equal? [Infographic]](https://www.onlyinfographic.com/wp-content/uploads/2014/03/diversity-in-higher-ed-960x460.png)
![Companies on Campus [Infographic]](https://www.onlyinfographic.com/wp-content/uploads/2014/03/Companies-on-Campus-960x460.png)
![Budget Cut Blues: How Special Education Students Are Among the Biggest Victims of Federal Spending Drops [Infographic]](https://www.onlyinfographic.com/wp-content/uploads/2014/02/budget-cut-blues-960x460.png)
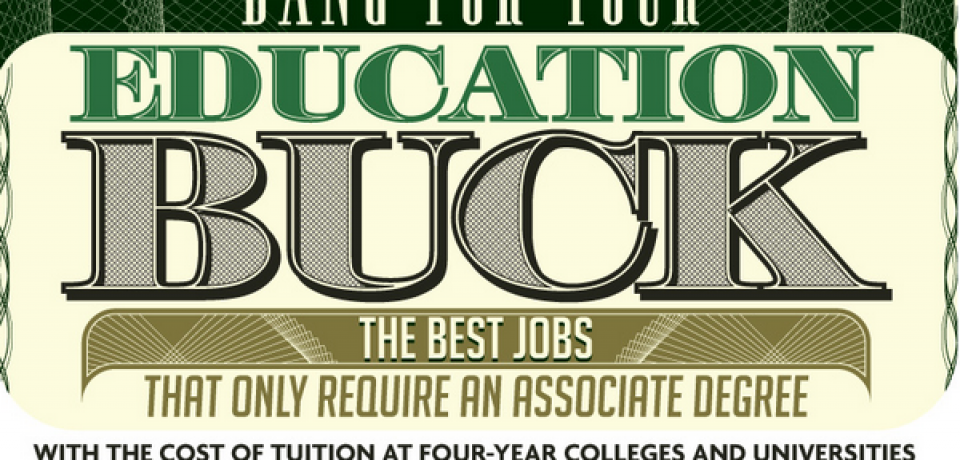


![Saving on College [Infographic]](https://www.onlyinfographic.com/wp-content/uploads/2013/11/degree-002-960x460.png)